The length of 40 leaves of a plant are measured correct to one millimetre, and the obtained data is represented in the following table:
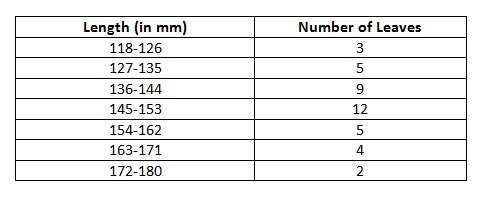
(i) Draw a histogram to represent the given data. [Hint: First make the class intervals continuous]
(ii) Is there any other suitable graphical representation for the same data?
(iii) Is it correct to conclude that the maximum number of leaves are 153 mm long? Why?
Answer (i)
We can note that the class intervals are not continuous. So, we will make them continuous.
Lower limit of any random class – Upper limit of previous class =127-126 = 1 and half of 1 is equal to 0.5.
So, we will subtract 0.5 from all the lower limits and will add 0.5 to all the upper limits. Doing so, we will have continuous class intervals:
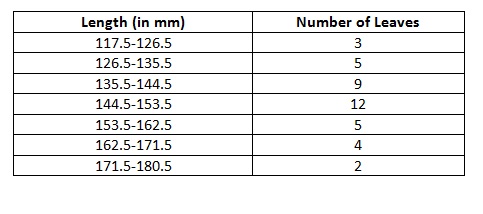
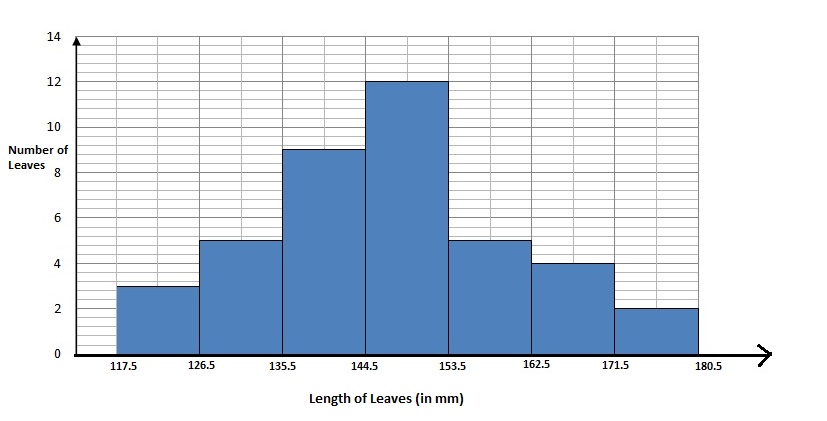
Now, we can easily represent this data with the help of histogram.
Answer (ii)
Yes, we can represent the same data using frequency polygon.
Answer (iii)
No, it is not right to say that the maximum number of leaves are 153 mm long because data only tells us that there are 12 leaves which are (144.5-153.5) mm long. Data does not tell us that how many leaves are 153 mm long.
Leave a Reply