The runs scored by two teams A and B on the first 60 balls in a cricket match are given below:
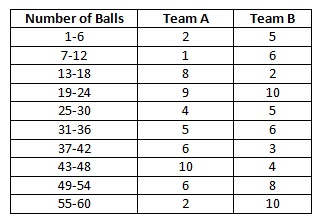
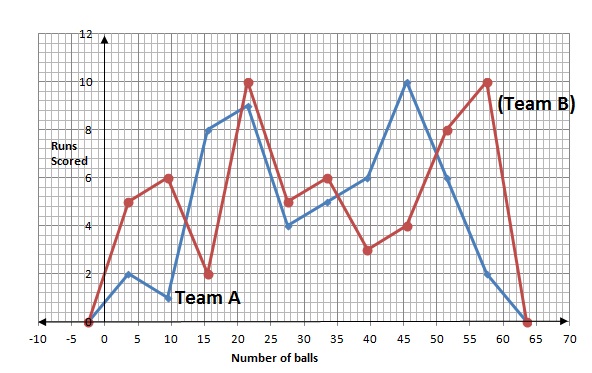
Represent the data of both the teams on the same graph by frequency polygons.
[Hint: First make the class intervals continuous.]
Solution:
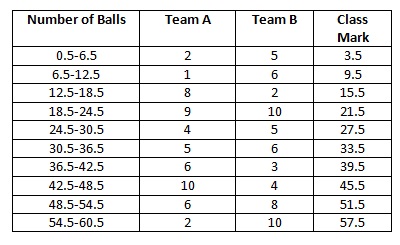
We can note that the class intervals are not continuous. So, we will make them continuous.
Lower limit of any random class – Upper limit of previous class = 7-6 = 1 and half of 1 is equal to 0.5.
So, we will subtract 0.5 from all the lower limits and will add 0.5 to all the upper limits. Doing so, we will have continuous class intervals:
We can find class marks for both of the teams. Class intervals are same for both the teams which means that class marks will also be same for both the teams.
Class mark =(lower limit + upper limit)/2
Now, we can draw frequency polygons for both the teams.
Leave a Reply