Quadratic function can be in the vertex form which is
![\[y=a(x-p)^2+q\]](https://mathinstructor.net/wp-content/ql-cache/quicklatex.com-b330576fa437511f609be8af125d28c5_l3.png "Rendered by QuickLaTeX.com")
or it can be in the standard form which is
![\[y=ax^2+bx+c\]](https://mathinstructor.net/wp-content/ql-cache/quicklatex.com-02d741b25f51fdf9a4519e20d586e25f_l3.png "Rendered by QuickLaTeX.com")
. We will just take random form and draw its graph using table of values.
Lets draw graph of
![\[y=x^2+2x+1\]](https://mathinstructor.net/wp-content/ql-cache/quicklatex.com-699a745973ed9b262f8a3f16f27c7401_l3.png "Rendered by QuickLaTeX.com")
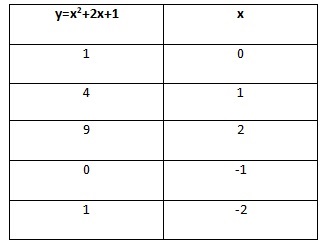
. To draw graph of this function, we need to create table of values. We will take some random values of x, put them in the given function and find corresponding values of y.
Lets take x=0, we get
![\[y=0^2+2(0)+1=0+0+1=1\]](https://mathinstructor.net/wp-content/ql-cache/quicklatex.com-68a48744727f3175eb4bcdf9c9aeadc3_l3.png "Rendered by QuickLaTeX.com")
If we take x=1, we get
![\[y=1^2+2(1)+1=1+2+1=4\]](https://mathinstructor.net/wp-content/ql-cache/quicklatex.com-972eb599c054b02a141180ca0ab2f0a7_l3.png "Rendered by QuickLaTeX.com")
If we take x=2, we get
![\[y=2^2+2(2)+1=4+4+1=9\]](https://mathinstructor.net/wp-content/ql-cache/quicklatex.com-e4d1c9e7db9bbc9abf64232eecde2590_l3.png "Rendered by QuickLaTeX.com")
If we take x=-1, we get
![\[y=(-1)^2+2(-1)+1=1-2+1=0\]](https://mathinstructor.net/wp-content/ql-cache/quicklatex.com-6c250dd5d3efb924027fc88b3c60e9ea_l3.png "Rendered by QuickLaTeX.com")
If we take x=-2, we get
![\[y=(-2)^2+2(-2)+1=4-4+1=1\]](https://mathinstructor.net/wp-content/ql-cache/quicklatex.com-5a85df4bae56f79abf39b426d8957b05_l3.png "Rendered by QuickLaTeX.com")
So our table of values are
Now we can plot these points and have graph of
which will be like

Lets take another random example of quadratic function
![\[y=2(x-1)^2+2\]](https://mathinstructor.net/wp-content/ql-cache/quicklatex.com-c13eddeaf08bfe2a227164c92f630969_l3.png "Rendered by QuickLaTeX.com")
and we will draw graph of this function using table of values again.
Lets take x=0, we get
![\[y=2(x-1)^2+2=2(0-1)^2+2=2+2=4\]](https://mathinstructor.net/wp-content/ql-cache/quicklatex.com-a85e3c2f23cc16ced6a739ae0d13e379_l3.png "Rendered by QuickLaTeX.com")
If we take x=1, we get
![\[y=2(x-1)^2+2=2(1-1)^2+2=2(0)^2+2=0+2=2\]](https://mathinstructor.net/wp-content/ql-cache/quicklatex.com-aa1ca925aa4523f62ffd60cfa47d6f02_l3.png "Rendered by QuickLaTeX.com")
If we take x=2, we get
![\[y=2(x-1)^2+2=2(2-1)^2+2=2+2=4\]](https://mathinstructor.net/wp-content/ql-cache/quicklatex.com-4b866178349d435e6cd11dccf3276e2e_l3.png "Rendered by QuickLaTeX.com")
If we take x=-1, we get
![\[y=2(x-1)^2+2=2(-1-1)^2+2=2(-2)^2+2=8+2=10\]](https://mathinstructor.net/wp-content/ql-cache/quicklatex.com-add82636fb0b26a4dcd4f9ec6b89009a_l3.png "Rendered by QuickLaTeX.com")
If we take x=3, we get
![\[y=2(x-1)^2+2=2(3-1)^2+2=2(2)^2+2=8+2=10\]](https://mathinstructor.net/wp-content/ql-cache/quicklatex.com-d7e79bb9552bdb840e6715c278be9a8b_l3.png "Rendered by QuickLaTeX.com")
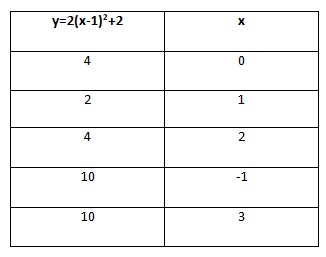
Now we can plot the graph using table of values and graph will look like.

Similarly we can graph other functions using same strategy.
Leave a Reply