The heights of 50 students, measured to the nearest centimetres, have been found to be as follows:
161 150 154 165 168 161 154 162 150 151
162 164 171 165 158 154 156 172 160 170
153 159 161 170 162 165 166 168 165 164
154 152 153 156 158 162 160 161 173 166
161 159 162 167 168 159 158 153 154 159
(i) Represent the data given above by a grouped frequency distribution table, taking the class intervals as 160 – 165, 165 – 170, etc.
(ii) What can you conclude about their heights from the table?
Solution (i)
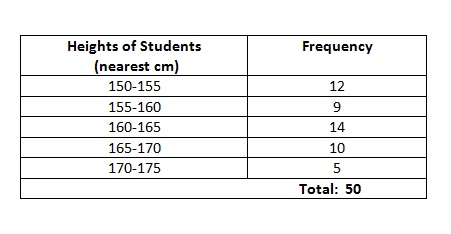
Solution (ii)
From the above grouped frequency distribution table, we can conclude number of things. One of the conclusion can be:
Less than 50 % of the students are taller than 165 cm.
Leave a Reply