100 surnames were randomly picked up from a local telephone directory and a frequency distribution of the number of letters in the English alphabet in the surnames was found as follows:
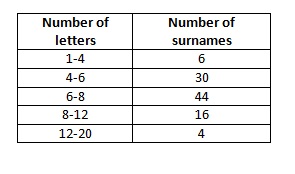
(i) Draw a histogram to depict the given information.
(ii) Write the class interval in which the maximum number of surnames lie.
Solution (i)
We can see that class intervals are not of the same size. So, the widths of the rectangles would not be same in this case if we construct a histogram. It would contradict with the general definition of the histogram which is that area of rectangles are proportional to the corresponding frequencies. To avoid this contradiction, we will adjust the lengths of the rectangles.
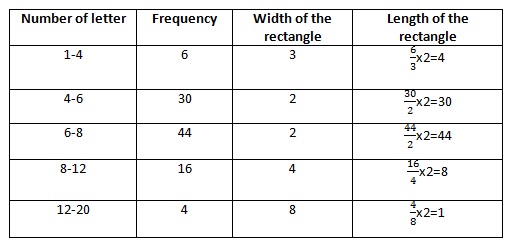
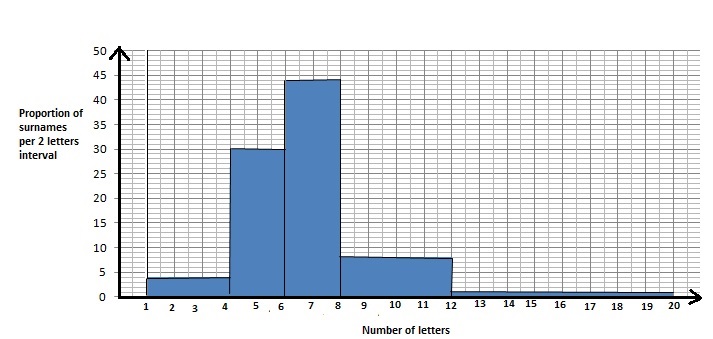
Now, we can construct a histogram using widths and lengths of rectangles.
Solution (ii)
6-8 is the interval in which the maximum number of surnames lie.
Leave a Reply