The relative humidity (in %) of a certain city for a month of 30 days was as follows:
98.1 98.6 99.2 90.3 86.5 95.3 92.9 96.3 94.2 95.1
89.2 92.3 97.1 93.5 92.7 95.1 97.2 93.3 95.2 97.3
96.2 92.1 84.9 90.2 95.7 98.3 97.3 96.1 92.1 89
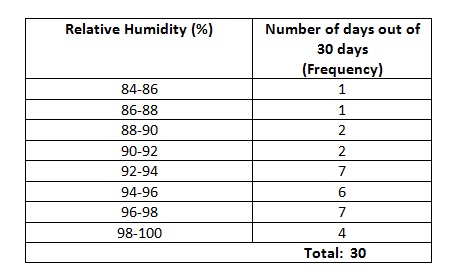
(i) Construct a grouped frequency distribution table with classes 84 – 86, 86 – 88, etc.
(ii) Which month or season do you think this data is about?
(iii) What is the range of this data?
Solution (i)
Solution (ii)
We can observe from the data that relative humidity is high in the whole month. There are great chances that it is a rainy season.
Solution (iii)
Maximum relative humidity = 99.2 %
Minimum relative humidity = 84.9 %
Range of the data
![\[=99.2-84.9=14.3\]](https://mathinstructor.net/wp-content/ql-cache/quicklatex.com-a0f394437dc26afeeab88fb327cb0093_l3.png "Rendered by QuickLaTeX.com")
Leave a Reply