The following table gives production yield per hectare of wheat of 100 farms of a village.
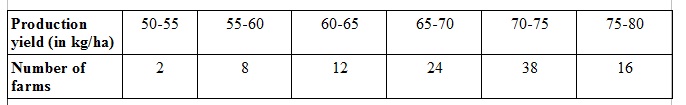
Change the distribution to a more than type distribution, and draw its ogive.
Solution:
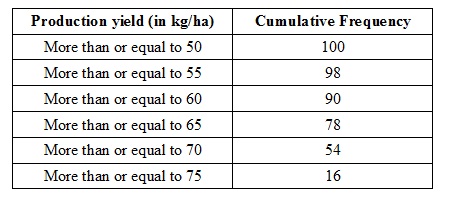
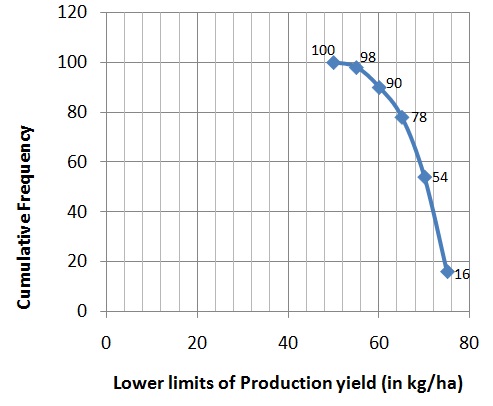
To draw ogive of more than type, we will have to plot points (50, 100), (55, 98), (60, 90), (65, 78), (70, 54), (75, 16).
Leave a Reply