The following table shows the ages of the patients admitted in a hospital during a year.
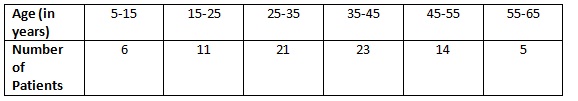
Find the mode and the mean of the data given above. Compare and interpret the two measures of central tendency.
Solution:
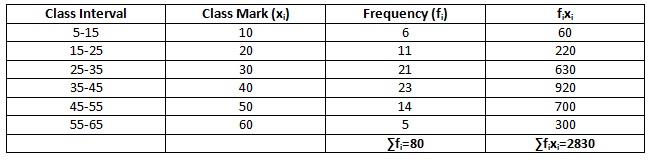
![\[\bar{x}=\frac{\sum{xifi}}{\sum{fi}}=(\frac{2830}{80}) =35.38\]](https://mathinstructor.net/wp-content/ql-cache/quicklatex.com-9b270e49492e513bbda51626d42d8126_l3.png "Rendered by QuickLaTeX.com")
Modal class = (35-45)
Lower limit of the modal class
![\[=l=35\]](https://mathinstructor.net/wp-content/ql-cache/quicklatex.com-96f22d23a7b9bd807b0b33eb65503793_l3.png "Rendered by QuickLaTeX.com")
Size of the class interval
![\[=h=10\]](https://mathinstructor.net/wp-content/ql-cache/quicklatex.com-afe135df852fca3bdbd30ab43becd6c7_l3.png "Rendered by QuickLaTeX.com")
Frequency of the modal class
![\[=f_1=23\]](https://mathinstructor.net/wp-content/ql-cache/quicklatex.com-a26197773f2c7bda9669b1f7109f61ab_l3.png "Rendered by QuickLaTeX.com")
Frequency of the class proceeding the modal class
![\[=f_0 =21\]](https://mathinstructor.net/wp-content/ql-cache/quicklatex.com-cd900236767cc7aefb403066bb4568e8_l3.png "Rendered by QuickLaTeX.com")
Frequency of the class succeeding the modal class
![\[= f_2 =14\]](https://mathinstructor.net/wp-content/ql-cache/quicklatex.com-150286d04e8004eac7b4adae8dbf42c3_l3.png "Rendered by QuickLaTeX.com")
Mode
![\[=l+\frac{f_1-f_0}{2f_1-f_0-f_2} \times h\]](https://mathinstructor.net/wp-content/ql-cache/quicklatex.com-cc7178c7e2b393134ff9a5d04c2a3734_l3.png "Rendered by QuickLaTeX.com")
![\[=35+(\frac{23-21}{46-21-14}) \times 10=35+1.8=36.8\]](https://mathinstructor.net/wp-content/ql-cache/quicklatex.com-f3d7dcec08777ecd180ded43422263bd_l3.png "Rendered by QuickLaTeX.com")
Therefore, the mean age of patient admitted to hospital
![\[=35.38\]](https://mathinstructor.net/wp-content/ql-cache/quicklatex.com-c33055bb9f1dd4f40f73652ee949cb6b_l3.png "Rendered by QuickLaTeX.com")
years
And, maximum number of patients admitted to hospital are 36.8 years old.
Leave a Reply